Hi everyone!
Have you ever wondered what happens when your primary server goes down? Your users get errors, your business loses money, and everyone panics. That’s why we need Disaster Recovery (DR).
In this blog, I will show you how to build a Cold Standby DR architecture on Google Cloud Platform. We’ll create a system that can switch to a backup region when things go wrong. One of the best part? It’s all automated with Terraform!
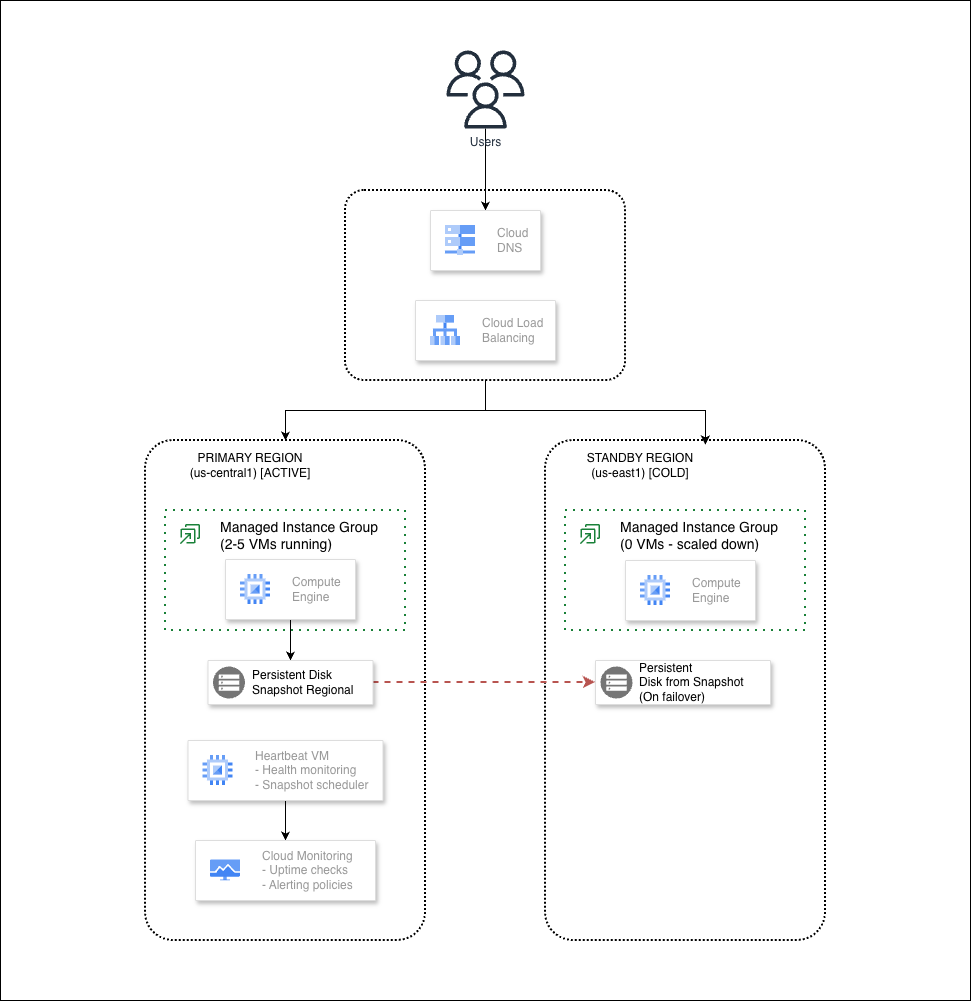
Before we start, let me explain what Cold Standby means.
Think about a highway. Your main road (primary) handles all the traffic every day. But there’s also an alternative road (standby) that exists. The road is built, but the barriers are closed. No cars use it.
One day, the main highway has a big accident. Traffic is stuck. What do you do? You open the barriers on the alternative road and redirect all cars there.
That’s Cold Standby. The backup road exists, but nobody drives on it. When disaster happens, we open the barriers and switch traffic to it.
Before starting, make sure you have:
First, let’s get the code. Open your terminal (or Cloud Shell) and run:
git clone https://github.com/misskecupbung/gcp-dr-cold-standby.git
cd gcp-dr-cold-standby

# Take a look at the folder structure
ls

You’ll see:
The setup script does a lot of work for you. It detects your GCP project, your email, and creates the configuration file.
./scripts/setup.sh
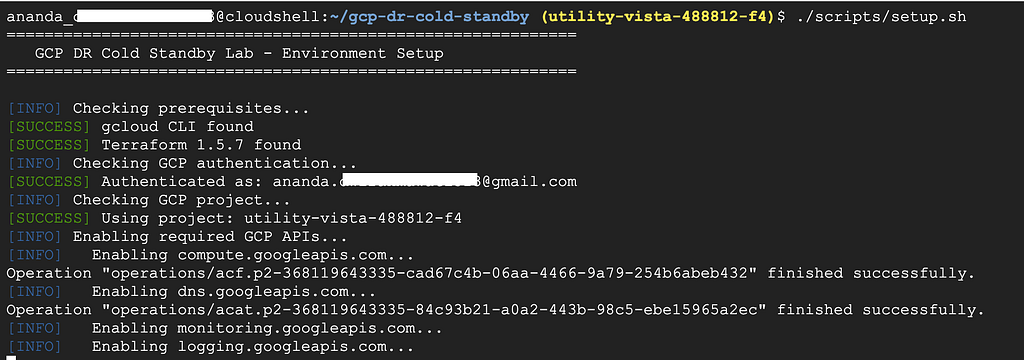
You should see output like this:

Feel free to modify the terraform.tfvars file. You can change the regions, instance sizes, or add your own domain name. Open it with any editor and adjust what you need.
Time to create everything in Google Cloud Platform!
./scripts/deploy.sh

When you see Do you want to apply these changes?, type yes and press Enter.
This takes about 5–10 minutes.
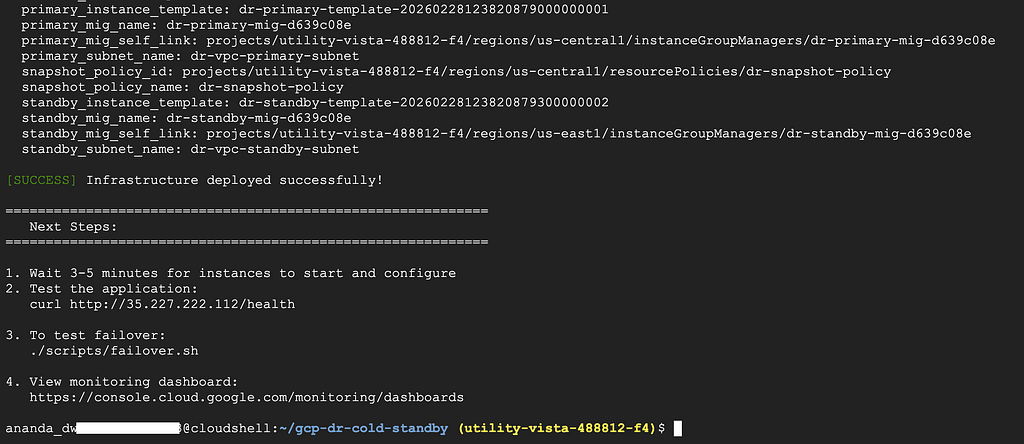
When it finishes, you’ll see the Load Balancer IP:
load_balancer_ip="35.227.222.112"
Save this IP, we’ll need it for testing.
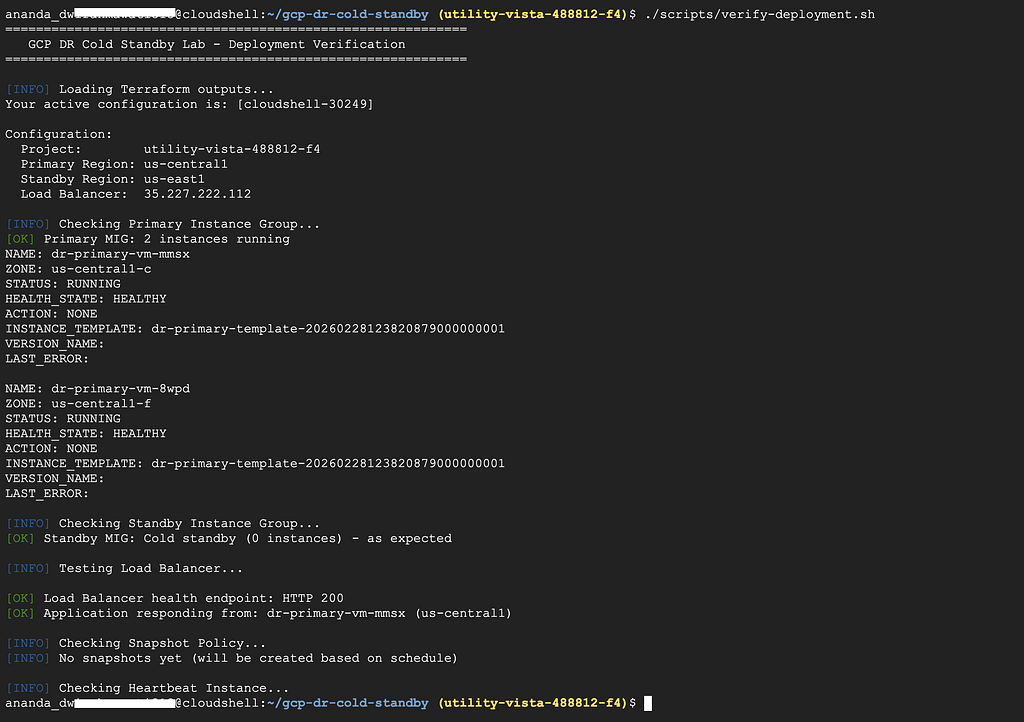
Let’s make sure everything works. Run the verification script:
./scripts/verify-deployment.sh
Or test manually with curl:
curl http://35.227.222.112/health

Or via browser directly:

You should see:
{"hostname":"dr-primary-vm-mmsx","region":"us-central1","status":"healthy","timestamp":"2026-02-28T12:54:13.354665"} Notice the region shows us-central1. That’s our primary region serving traffic.
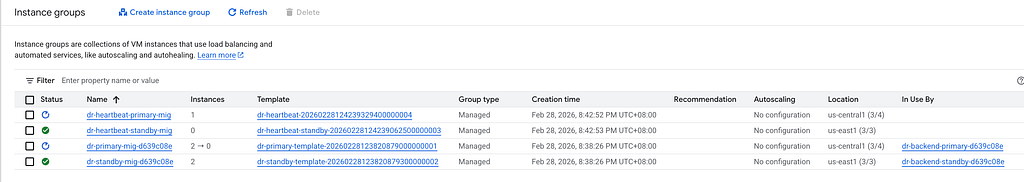
Go to Compute Engine > Instance Groups. You should see:

Go to Network Services > Load Balancing in GCP Console.

Click on dr-url-map-d639c08eto see details:

Notice only the primary backend shows healthy instances. The standby has zero instances.
Go to Compute Engine > Snapshots
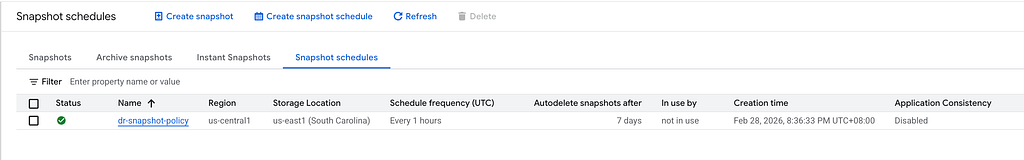
The system creates automatic snapshots every hour. If disaster happens, we can restore data from these snapshots.
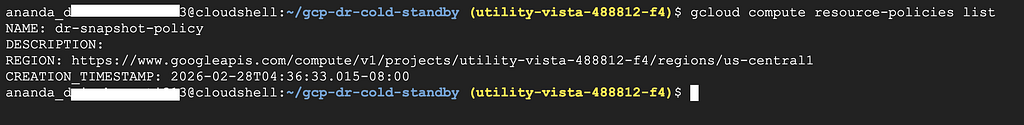
Check the snapshot policy:
gcloud compute resource-policies list
Now let’s simulate a disaster. We’ll pretend the primary region is down and switch to standby.
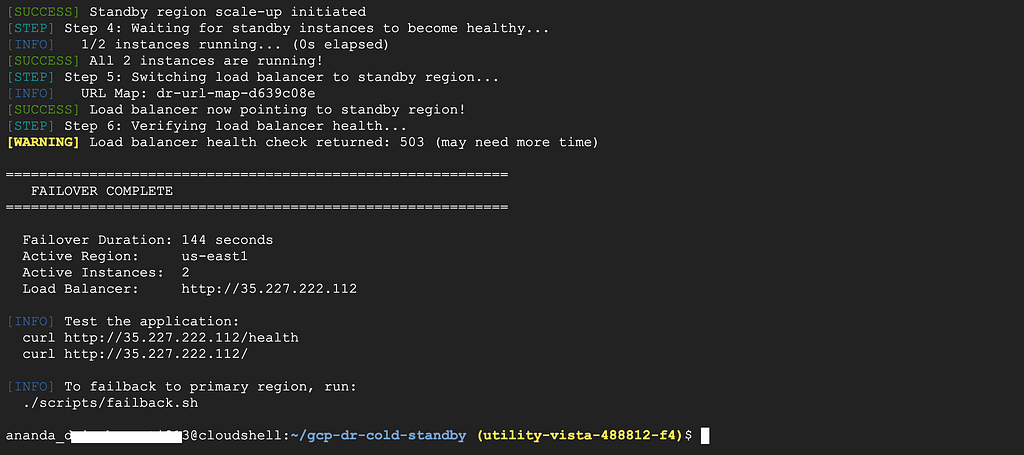
./scripts/failover.sh

Type yes when asked to confirm.
Test the application again:
curl http://35.227.222.112/

Or via browser:

Now you should see:
{"hostname":"dr-standby-vm-6gk0","message":"DR Cold Standby Lab - Application Running","region":"us-east1","timestamp":"2026-02-28T13:04:12.558283"} The region changed to us-east1! Traffic is now going to the standby region.
That’s failover working!
Disaster is over, let’s go back to primary.
./scripts/failback.sh
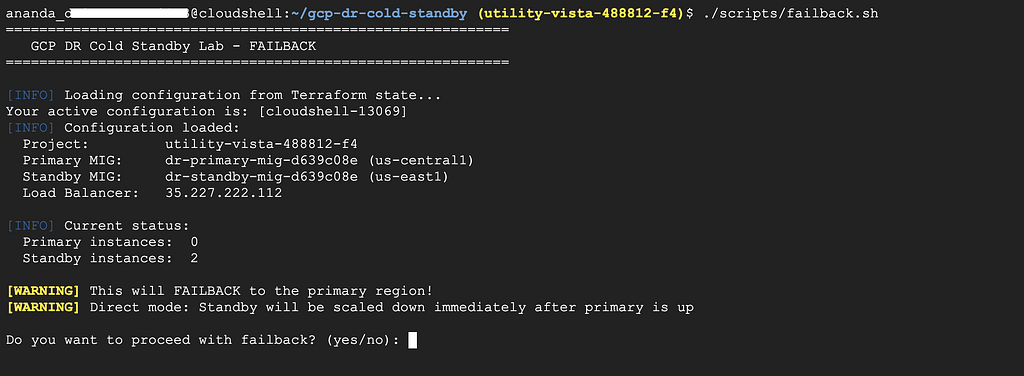
Type yes to confirm.

Test again:
curl http://35.227.222.112/health

Or via browser

It shows like:
{"hostname":"dr-primary-vm-084q","region":"us-central1","status":"healthy","timestamp":"2026-02-28T13:39:02.604194"} We’re back to primary!
For regular DR testing, use the automated test script:
./scripts/test-failover.sh --simulate-failure --full
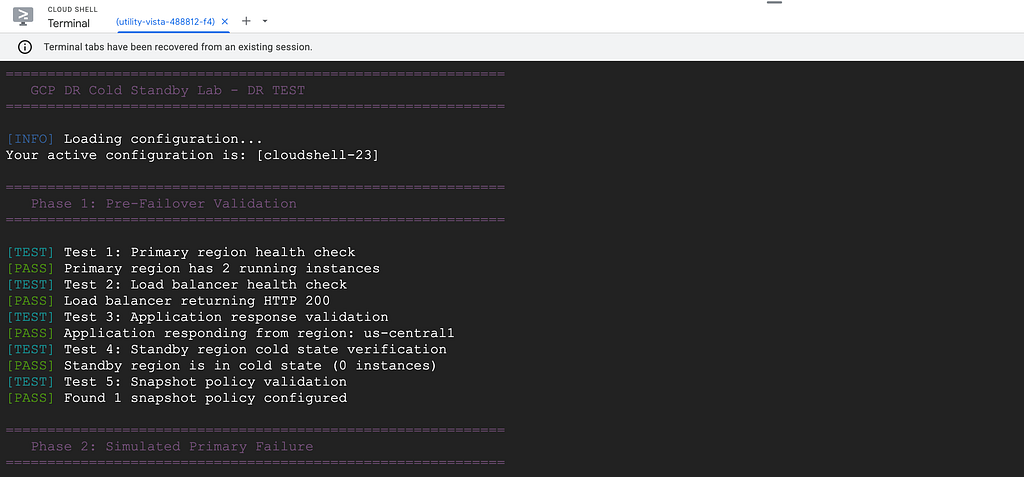
This script:
The lab configures real email alerts that notify you when something goes wrong. You’ll receive an email when the primary region goes down, and another when it returns to healthy.
Go to Monitoring > Dashboards in GCP Console.
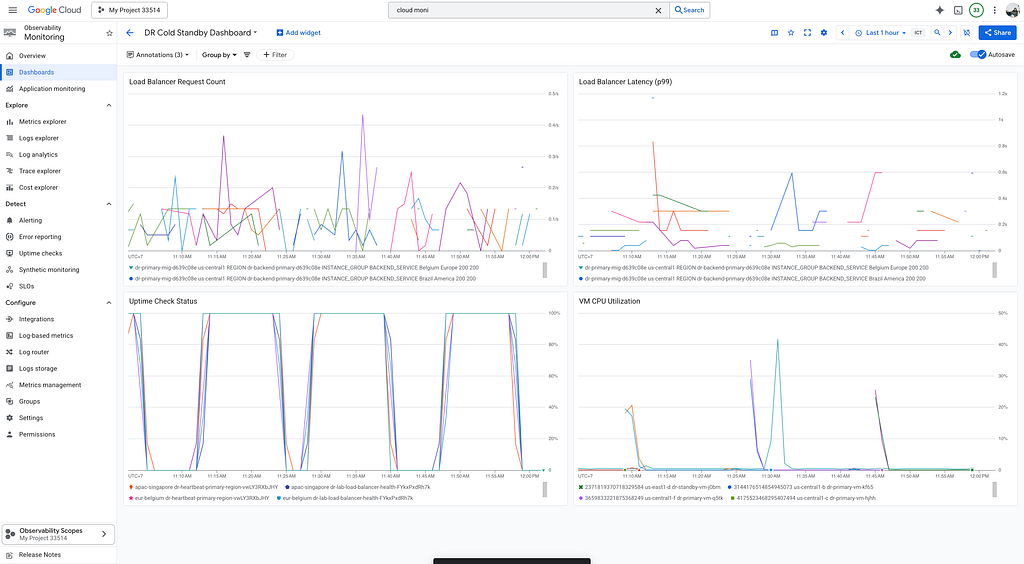
You’ll find a dashboard called DR Cold Standby Dashboard that shows:
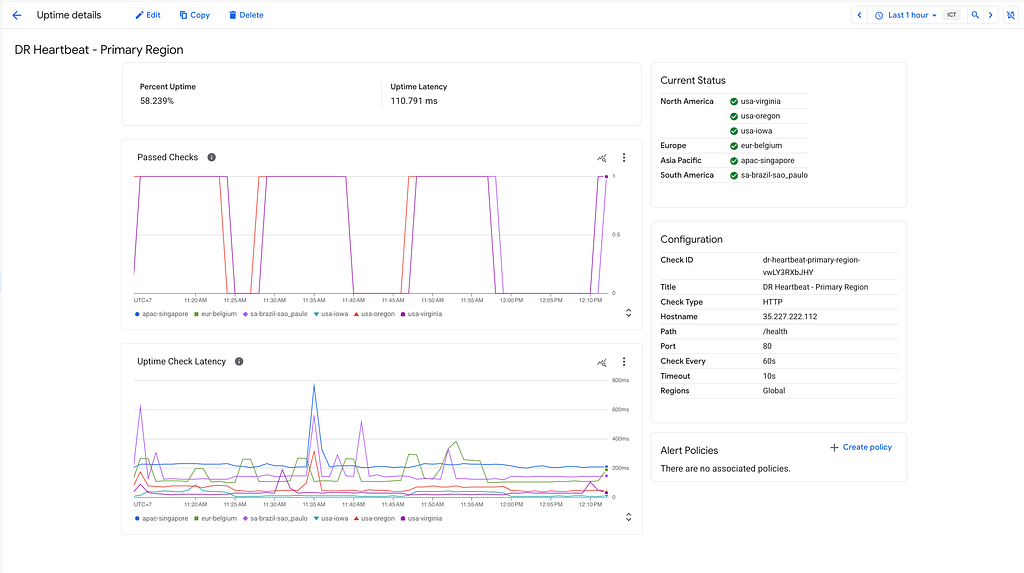
Go to Monitoring > Uptime checks.
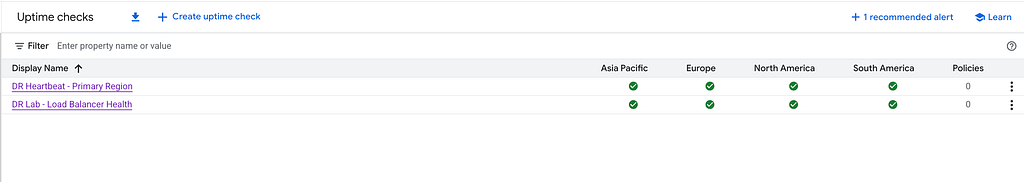
The system pings your application every minute. If the health check fails, you’ll know immediately.
Here is what the DR Heartbeat — Primary Region looks like:
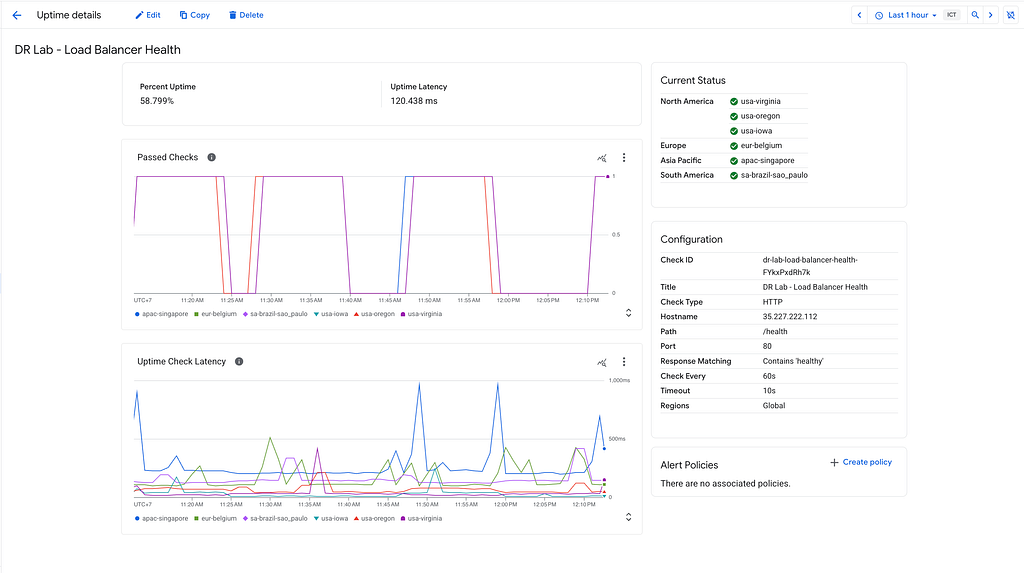
And below is what the Load Balancer Health uptime dashboard looks like:
Go to Monitoring > Alerting.
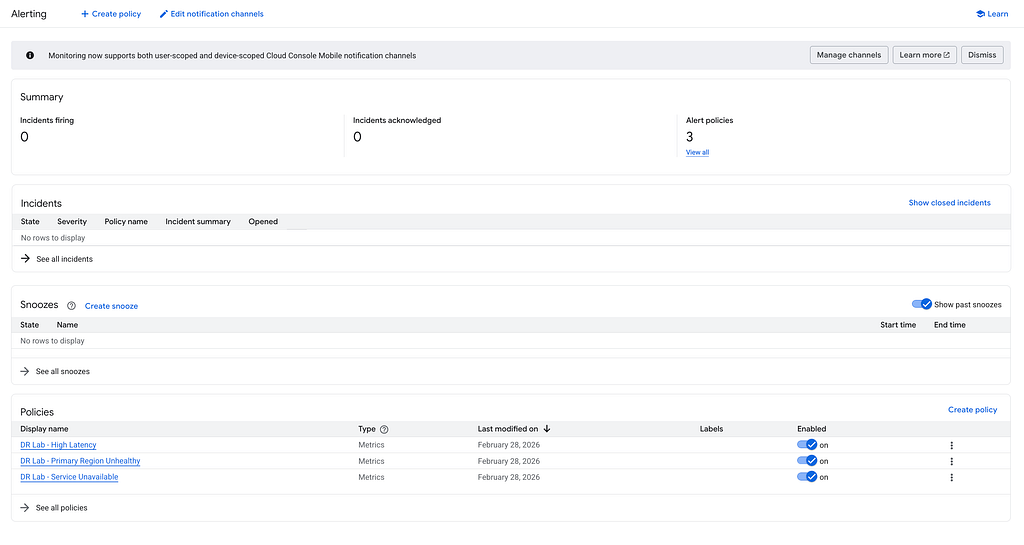
The lab creates 3 alert policies:
When I tested the failover, I actually received an email alert! It looked like this:
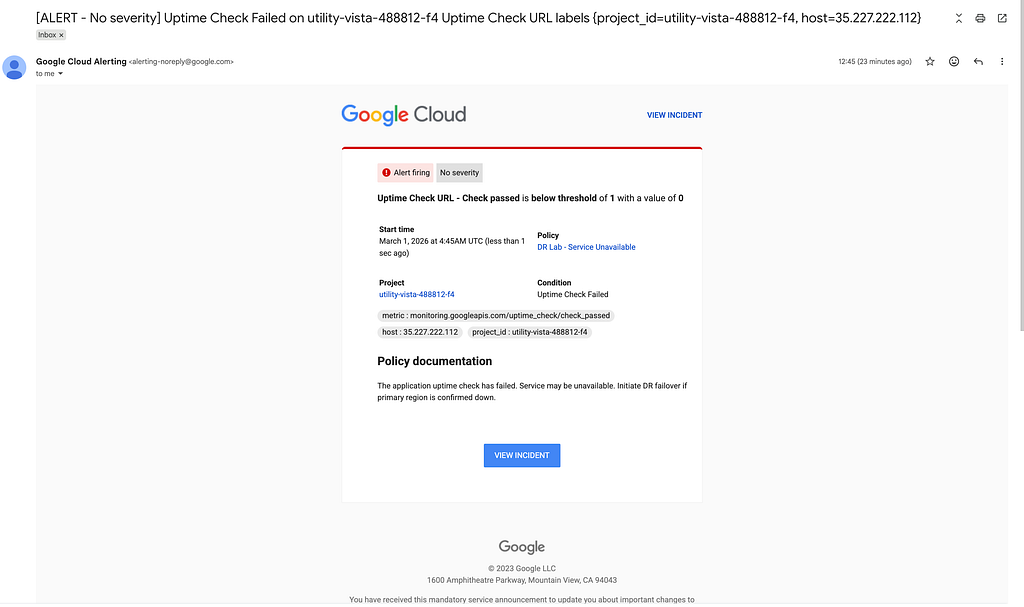
I also received an email when the system became healthy again

This is what production systems need. You don’t want to find out your app is down from customers.
When you’re done, delete everything to avoid charges:
./scripts/cleanup.sh
Or manually:
cd terraform
terraform destroy

Type yes to confirm. All resources will be deleted.
Thanks for reading! Drop a comment if you have any questions or feedback!
<hr><p>Build Your Own Disaster Recovery on GCP: Cold Standby Architecture was originally published in Google Cloud - Community on Medium, where people are continuing the conversation by highlighting and responding to this story.</p>